Real Estate Website’s “20 Maps of Philly” Screws Up Real Estate Part

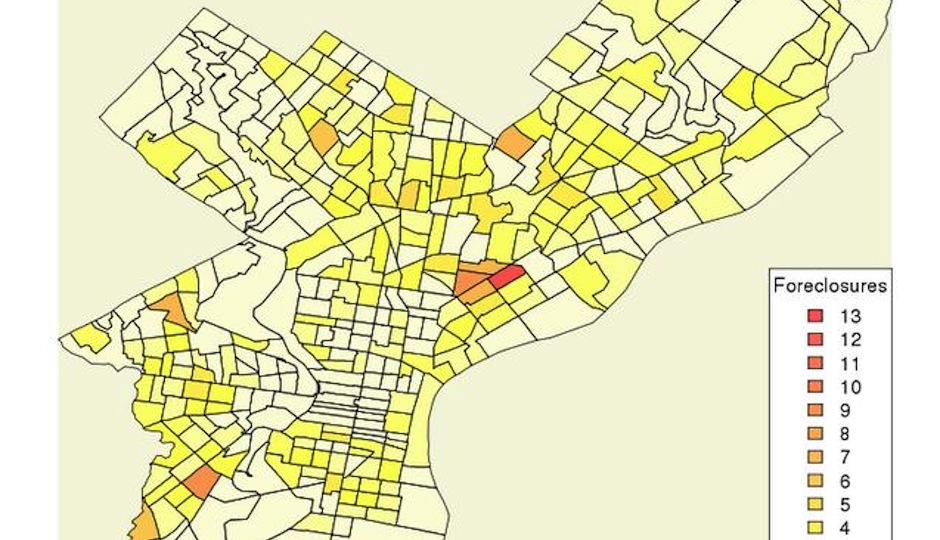
A fragment of the 2009 map used by movoto.com.
This week, Movoto, an online real estate brokerage, posted “20 Maps Of Philadelphia You Didn’t Study In Geography” on its content marketing blog. It’s really silly, poorly executed, and if it weren’t for Policymic’s “25 Most Important Maps of 2013” (which is actually really good), it wouldn’t exist at all.
But what’s really egregious about the map post is that its one explicitly real estate-related map — of Philadelphia foreclosures — is from 2009, is completely impossible to decipher, and links to no reference for the information. Come on, kids. You’re in the real estate biz. Surely you can do better than this. Or at least we can.
RealtyTrac released its latest foreclosure report this morning, and its results show a national improvement overall. But it gets complicated when you drill down into individual cities, or Metropolitan Statistical Areas (MSAs). Of the five metros with the highest population, Philadelphia’s MSA has the lowest number of properties with negative equity.
However, 1 in every 808 homes in Philadelphia County was in foreclosure as of November — which is well above the national average. Also in November, the number of Philly properties that received a foreclosure filing was 14% — which is lower than it was in October, but 28% higher than it was in October 2012.
If you look at the Pennsylvania map, above, you’ll see that Philadelphia is by no means off the hook when it comes to foreclosures.
Even going back to 2012, out of the 50 largest MSAs, according to DSNews, Philadelphia saw one of the largest increases in foreclosure activity: 33%.
So next time you do one of those lists that we’re all doing now so we can get traffic like BuzzFeed, please include real estate info that’s post-2009. Since real estate is your bag, you know. Meanwhile, feel free to play with the below tool from RealtyTrac.


