What Two Centuries of Census Records Taught Us About Philadelphia
The hidden story behind all those numbers.
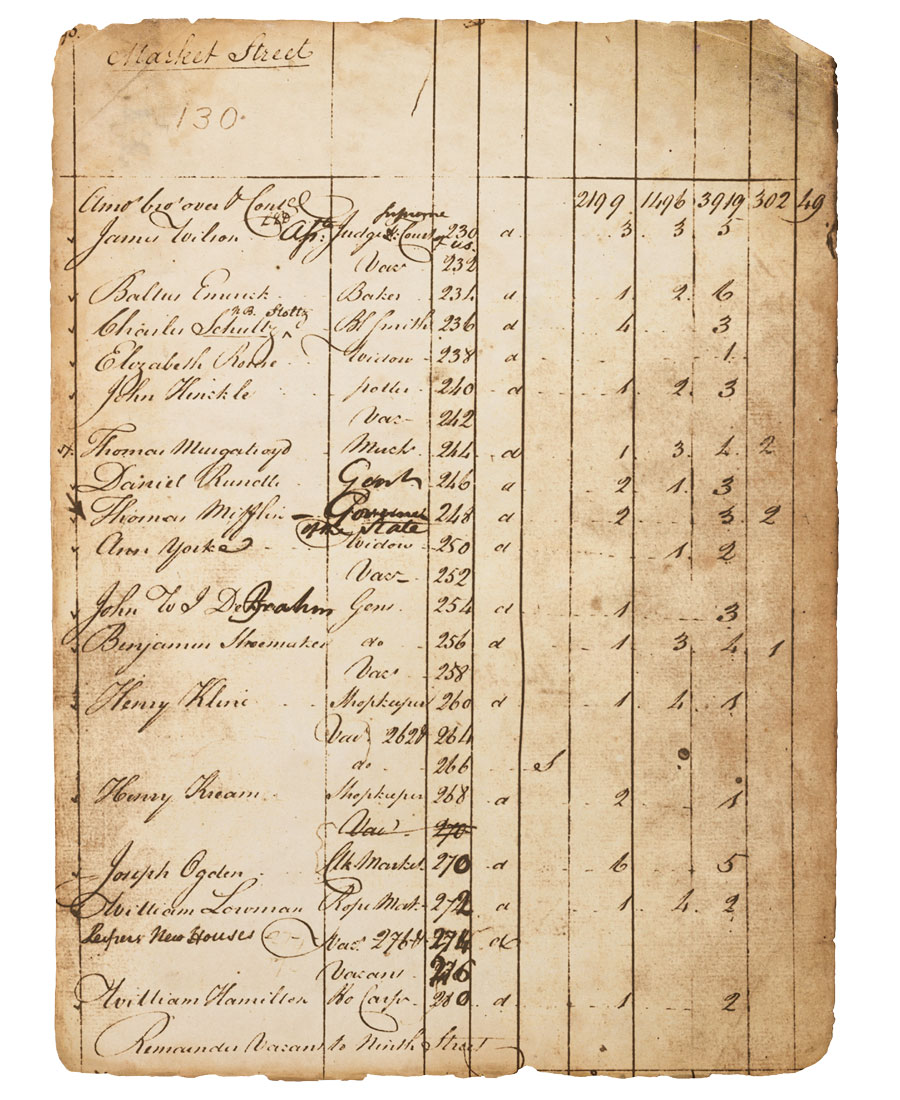
A detail of the 1790 census form. Image courtesy United States Government
More than two centuries after Congress (meeting right here in Philly) first decreed it, the census takers will be out again this year. The results of the once-a-decade count — not to mention the questions themselves — tell a hidden story about our city … and our country.
1790
City Population: 28,522
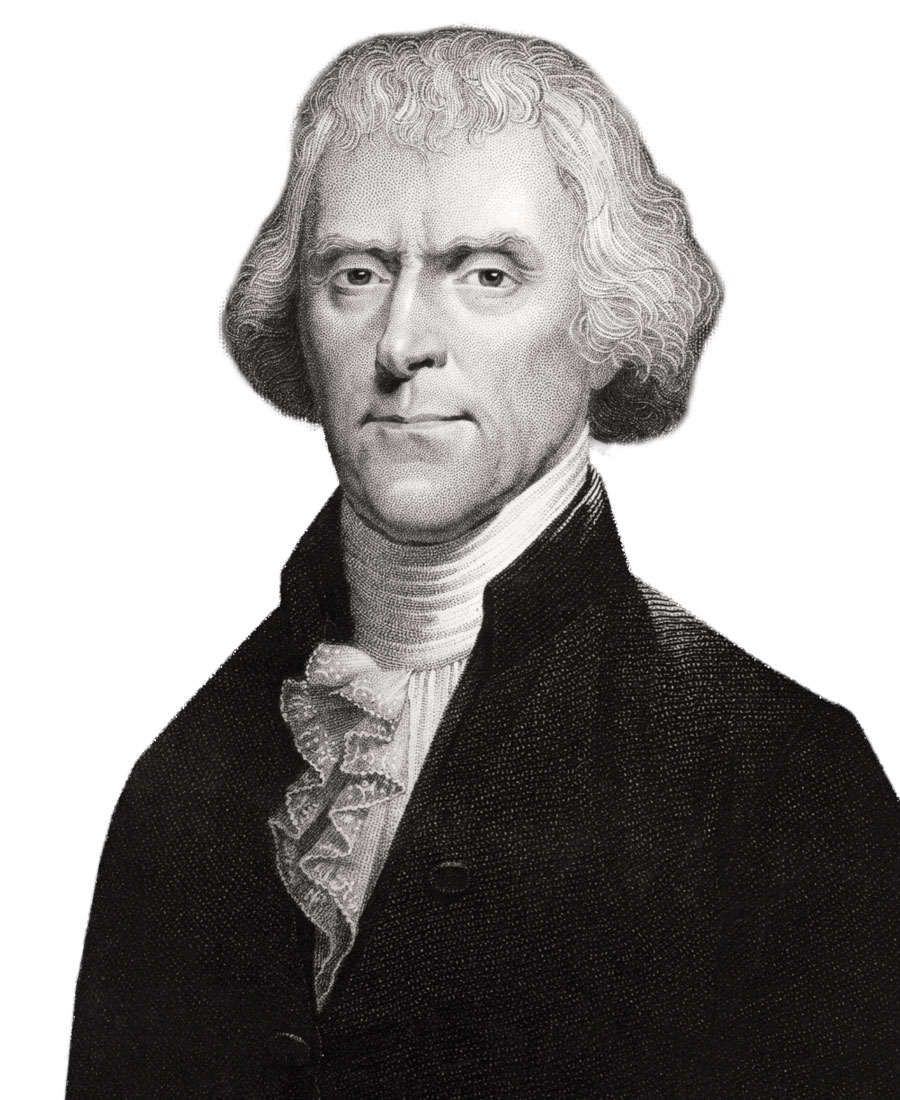
Thomas Jefferson. Image via Getty Images
→ In 1790, Philadelphia has 1,630 black residents, 5.7 percent of its population. By 1830, all of the city’s 14,500 blacks are free.
→ The 1790 census costs $44,000, or 1.1 cents per capita; the final report is 56 pages long. The director is Thomas Jefferson, and six questions are asked.
→ As set out in Article 1, Section 2 of the U.S. Constitution, representation in the House is to be apportioned by “the whole number” of free persons counted in the 1790 census plus three-fifths of all other persons.
1800
City Population: 41,220
→ The questionnaire for the 1800 census counted free white males and females in five age categories: under 10; 10 but under 15; 16 but under 25; 25 but under 45; and over 45. Native Americans, slaves and free blacks were counted in single categories without ages.
1810
City Population: 53,722
1820
City Population: 63,802
→ The 1820 census was the first to ask if respondents worked in agriculture, commerce or manufacturing.
1830
City Population: 80,462
→ Philadelphia is the second-most-populous U.S. city from the first census, in 1790, through 1830, when Baltimore moves into the second spot. Philly regains it in 1860, then loses it permanently in 1890, to Chicago.
1840
City Population: 93,665
→ In 1840, the census for the first time asks for the number of “insane” and “idiotic” household members. By 1900, the question is gone.
→ The 1840 census is the first to ask about literacy; the 1850 census adds a question on school attendance.
1850
City Population: 121,376
→ The 1850 census contains a supplemental schedule for slaves.
1860
City Population: 565,529
→ Seven consecutive years of famine in Ireland in the mid-19th century send hundreds of thousands of refugees to America; by 1860, there are 95,458 Irish here, making up the largest immigrant group in the city.
→ The Act of Consolidation in 1854 subsumes more than two dozen surrounding districts and townships into the city limits. The change helps account for a 366 percent leap in population between 1850 and 1860.
1870
City Population: 674,022
→ The percentage of black residents reaches a nadir of 3.3 percent in 1870, then grows steadily to 42.6 percent in 2018.
1880
City Population: 847,170
1890
City Population: 1,046,964
→ In 1890, the largest group of foreign-born Philadelphians is still the Irish, who make up 41 percent of immigrants.
→ The 1890 census is the first to show multiple cities with populations of more than a million, including Philadelphia.
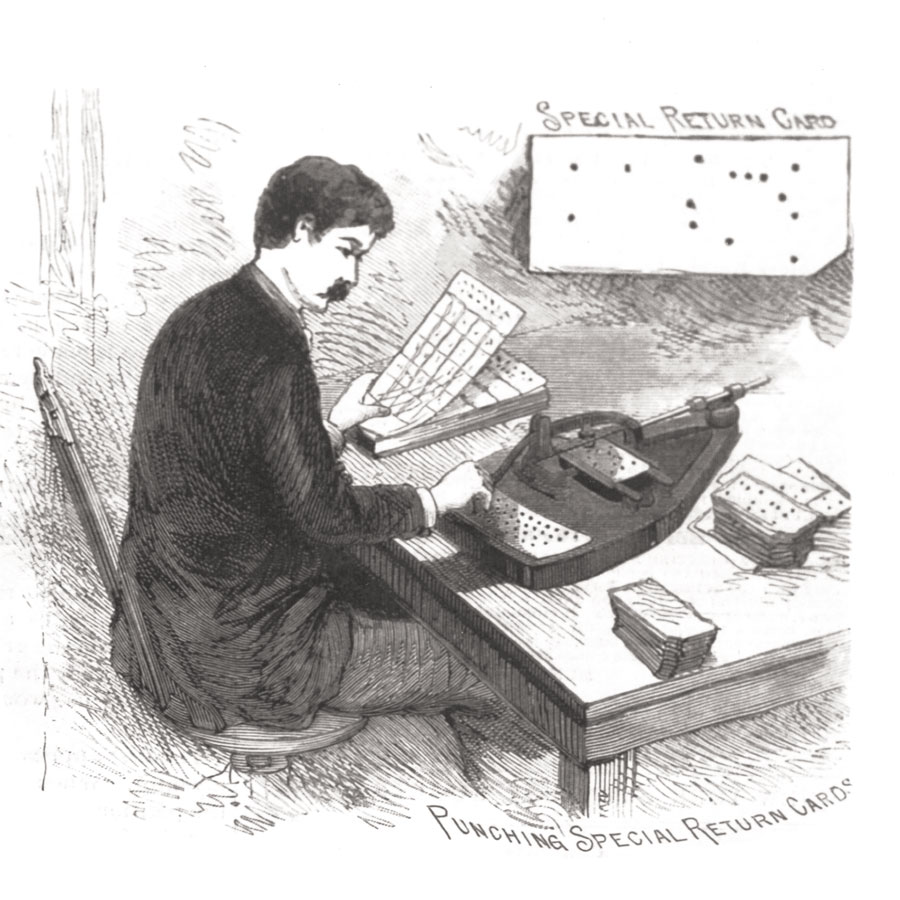
For the 1890 census, data was entered on punch cards and tabulated by machine. Image via Getty Images
→ The 1890 census is the first in which data is entered on punch cards and tabulated by machine. Time required to compile results is reduced from eight years for 1880 to just six years, with a rough count released after a mere six weeks — leading to general public rejection of the results.
1900
City Population: 1,293,697
→ The 1900 census is the first to ask whether respondents can speak English.
→ The 1900 census is the first to ask whether a respondent’s home is owned or rented and, if owned, whether it’s mortgaged.
→ In 1900, for “Color or Race,” choices are W for white, B for black, Ch for Chinese, Jp for Japanese, and In for American Indian. A separate schedule for Indians includes the question, “Is this person living in polygamy?”
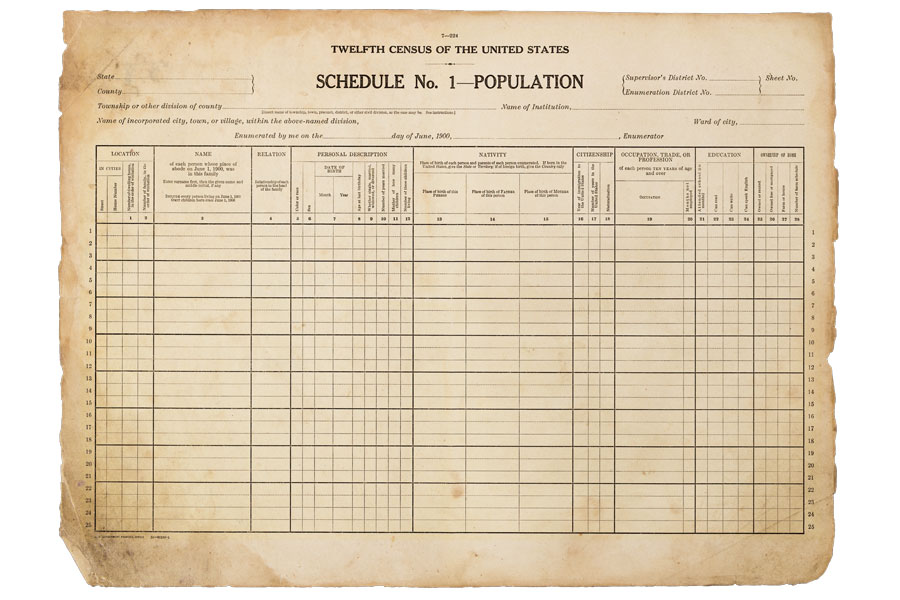
A 1900 census form. Image courtesy United States Government
1910
City Population: 1,549,008
→ The 1910 census lists more than 30 questions, among them whether anyone in the household is a survivor of the Union or Confederate Army or Navy.
→ Between 1870 and 1900, the number of Italians in the city goes from just 516 to 17,830 —then surges to 76,734 in 1910 and 182,368 by 1930.
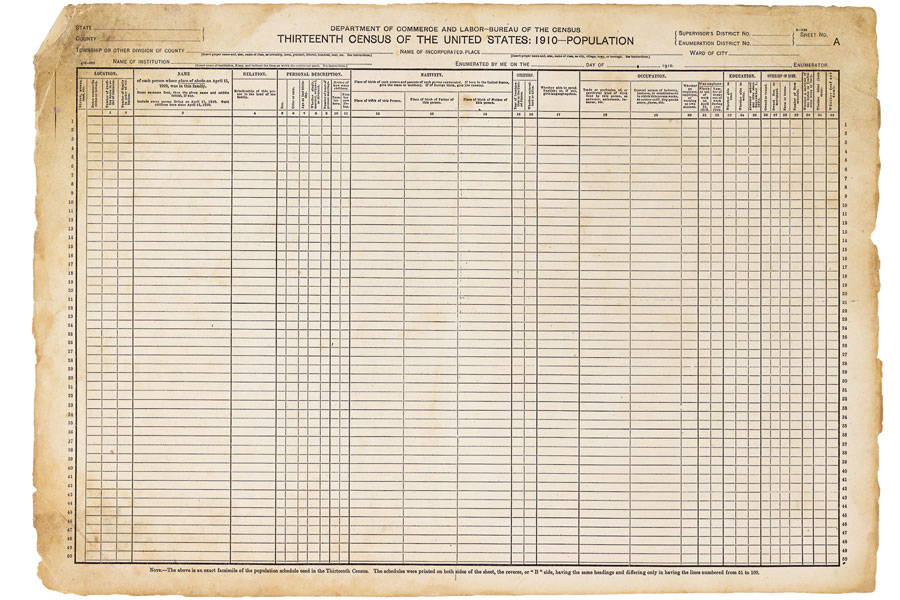
A 1910 census form. Image courtesy United States Government
1920
City Population: 1,823,779
→ In 1920, the largest group of immigrants in Philadelphia is Russian, mostly Jews fleeing pogroms.
1930
City Population: 1,950,961
→ During the Great Migration, the city’s black population grows from 84,549 in 1910 to 134,229 in 1920. By 1930, half of the city’s 219,599 black residents come from four states: Maryland, South Carolina, Georgia and Virginia.
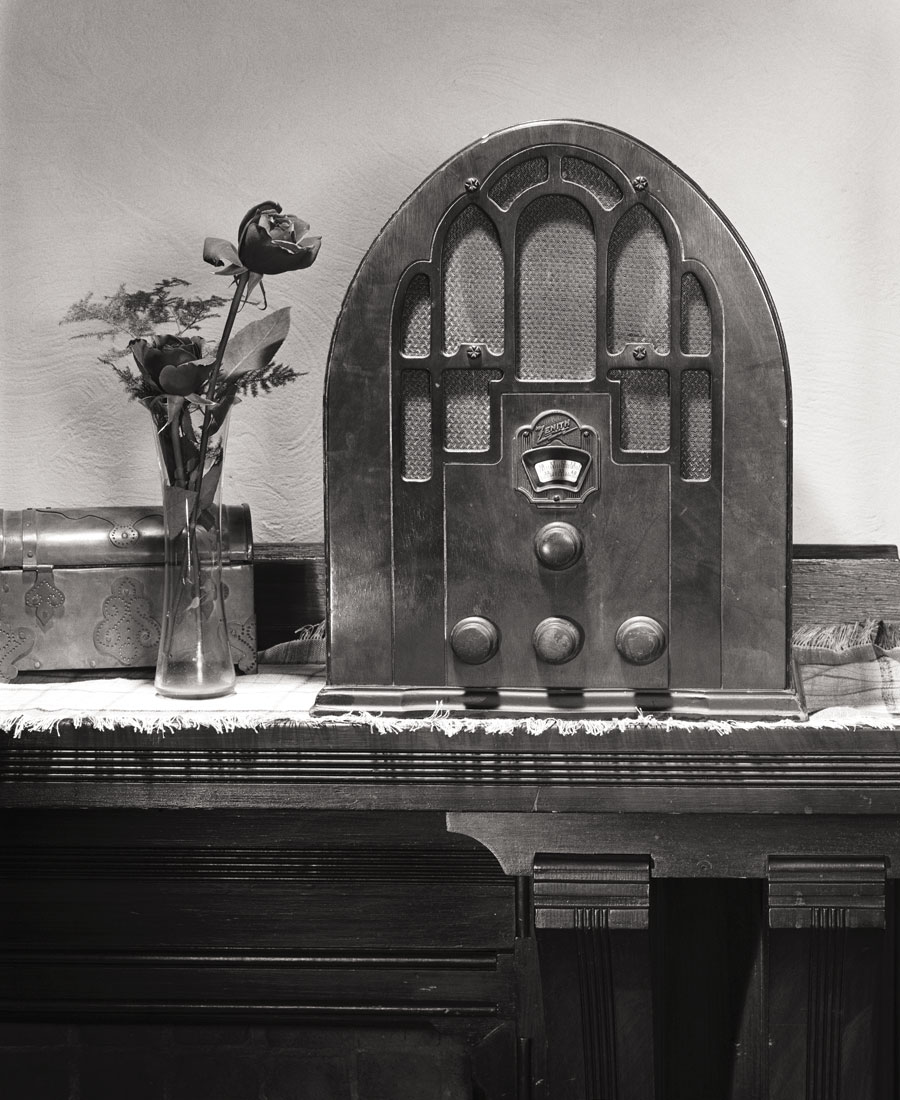
The 1930 census asked if households had radios. Image via Getty Images
→ The 1930 census asks whether the household has a radio.
1940
City Population: 1,931,334
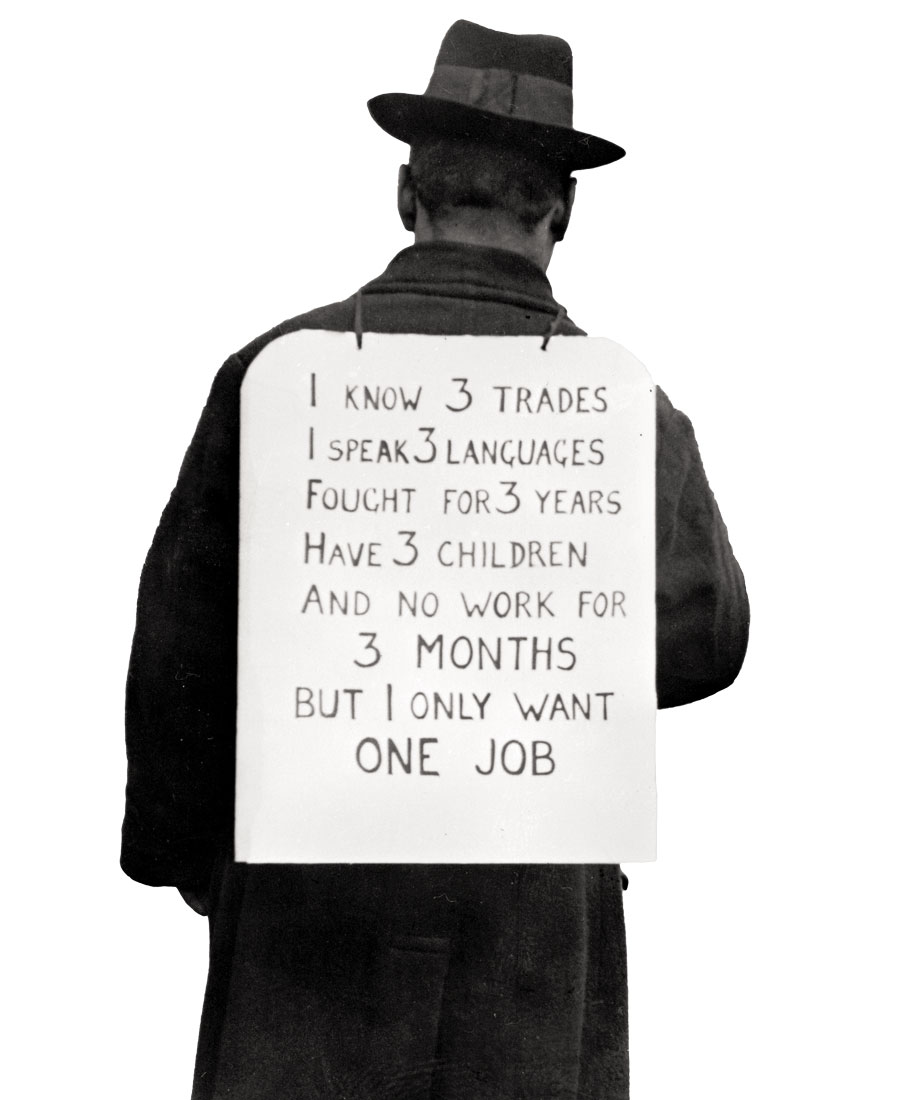
The 1940 census took place in the wake of the Great Depression. Image via Getty Images
→ In the wake of the Great Depression, the 1940 census asks 11 questions related to jobs, including hours worked in a week; whether respondents are in private, non-emergency government or public emergency work; and duration of unemployment.
PEAK PHILLY: 1950
City Population: 2,071,605
→ The 1950 census is the last to ask respondents whether they’re naturalized citizens.
→ The ENIAC computer developed at Penn for the U.S. War Department in the 1940s is updated into UNIVAC I, the first successful civilian computer, built for the Census Bureau and dedicated in 1951.
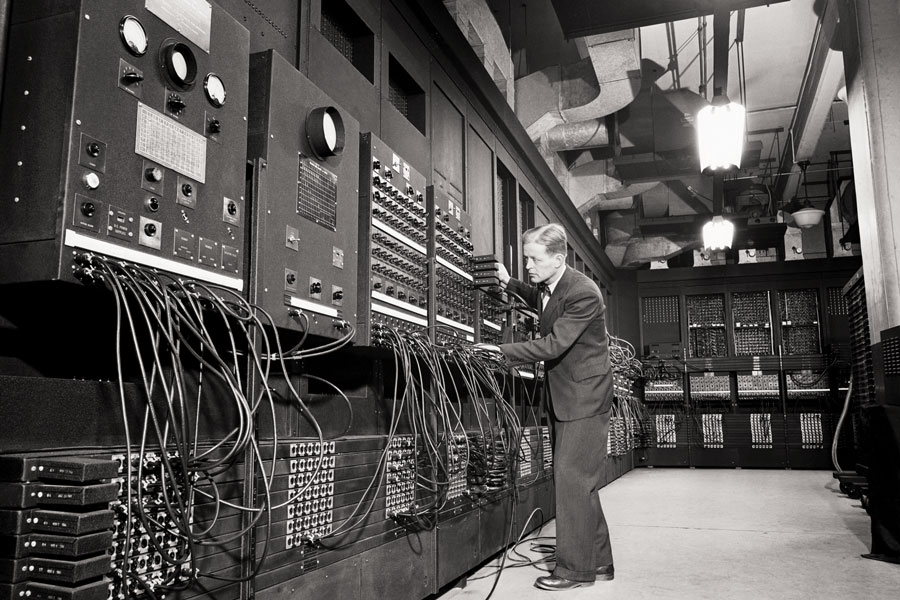
The ENIAC computer. Image via Getty Images
1960
City Population: 2,002,512
1970
City Population: 1,948,609
→ The 1970 census is the first to have a long and a short form.
1980
City Population: 1,688,210
→ After Latino activists complain during the 1970s, the Census Bureau adds a separate category for Hispanics and Latinos in 1980. (The 1970 census included the category only on the long form.)
→ The 1980 census is the first in which respondents self-identify race/ethnicity rather than having it designated by the census taker. More than 63,570 city residents self-report being of Hispanic origin — 3.8 percent of the population.
1990
City Population: 1,585,577
→ Three men who will become president serve as directors of the census: Thomas Jefferson in 1790, John Quincy Adams in 1820, and Martin Van Buren in 1830. The post is held by a sea of white male faces until Barbara Everitt Bryant is appointed for the 1990 census. She’s succeeded by Martha Farnsworth Riche. Still all white, though.
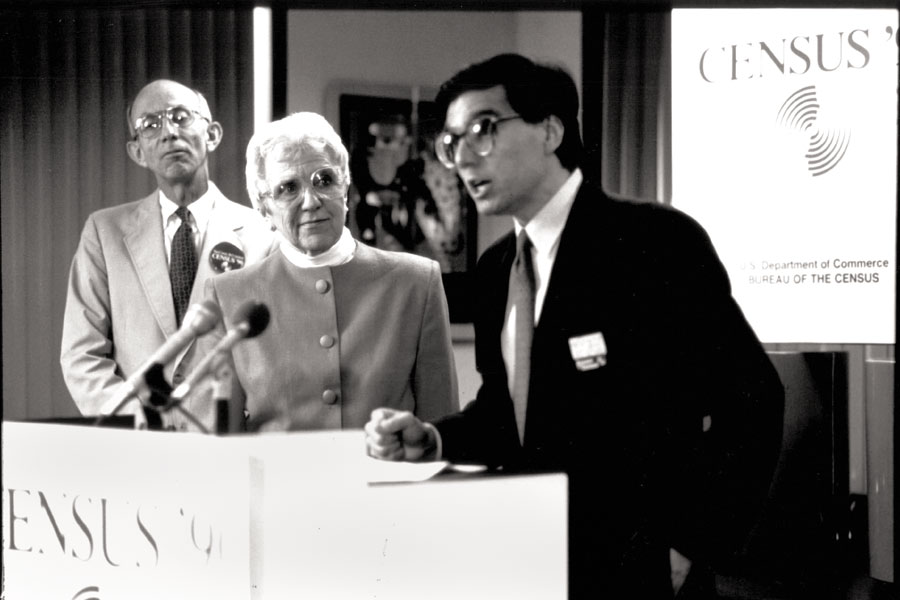
Barbara Everitt Bryant was appointed director for the 1990 census. Image via Getty Images
2000
City Population: 1,517,550
→ Between 1950 and 2000, the city’s overall population shrinks by 26.7 percent due to the nationwide trend of “white flight,” as upper- and middle-class families depart for the suburbs. The city’s black population grows from 376,041 to 655,824 in the same time span — a leap of 74 percent.
2010
City Population: 1,526,006
→ Between 2000 and 2010, Philly’s Hispanic population grows by 44 percent, and its Asian population by 42 percent. Data from 2010 shows the first overall increase in city population since 1950. It’s estimated that 97 percent of the region’s total population increase from 2000 to 2020 will be from non-white residents.
2020
→ For the 2020 census, the Obama administration proposes refining racial categories to add “Hispanic, Latino, or Spanish” and “Middle Eastern or North African” as options. The Trump administration nixes the changes, which were intended to address the fact that “some other race” was the third-ranked racial group in results from 2000 and 2010.
→ $15.6 billion: Estimated cost of the 2020 census, with 500,000 temporary workers to be hired.
Published as “Census Sensibility” in the January 2020 issue of Philadelphia magazine.


