Report: Philly Is Gentrifying More Than San Francisco, the Poster Child for Displacement
Whether you see that conclusion as a warning or a blueprint probably depends on whether you’re a developer.
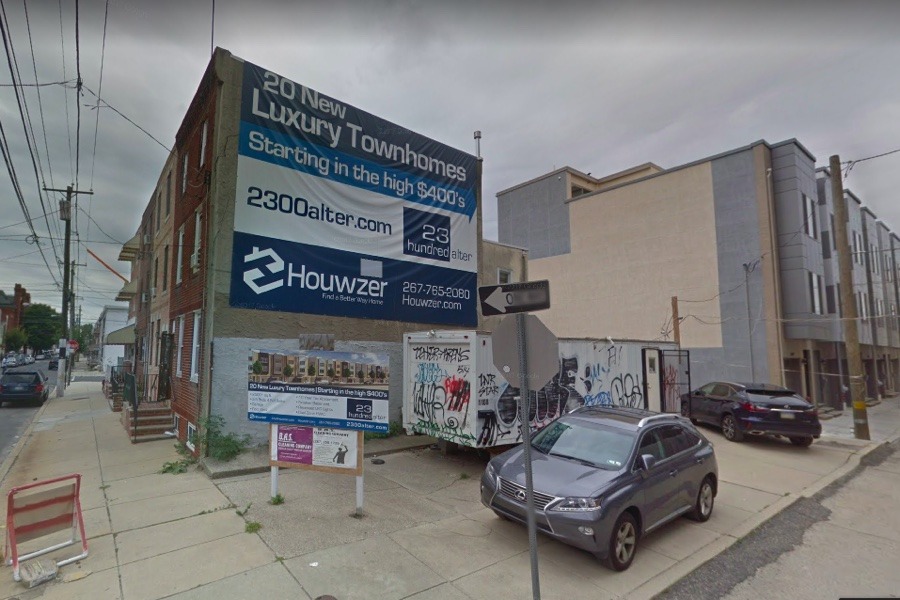
Photo via Google Maps.
Gentrification is happening across the country, but conventional wisdom would have you believe that much of the most vigorous activity is centered around West Coast cities in the midst of a tech boom.
A new report from the National Community Reinvestment Coalition, a Washington, D.C.-based policy group, casts some serious doubt on that assumption. While places like San Francisco, Portland, and Seattle have indeed grappled recently with rising housing costs and an influx of new residents, none of them has experienced as much gentrification as Philadelphia, according to the NCRC. From 2000 to 2013, 57 different census tracts in Philly became gentrified. That’s the fourth-highest figure in the country during that span, behind only New York, Los Angeles, and Washington, D.C.
That gentrification is happening here in Philly should come as a surprise to precisely no one. One need only look at how neighborhoods like Northern Liberties and Graduate Hospital have changed in the last couple of decades to see the forces at play in real life. But more than San Francisco — really?
The NCRC classified an area as eligible for gentrification if it had, according to census data from 2000, a median household income and home value below the 40th percentile of the surrounding region. Thanks to a handy interactive map published as part of the study, we can see clearly in Philadelphia that huge swaths of the city — anything on the map shaded with color — were candidates for gentrification.
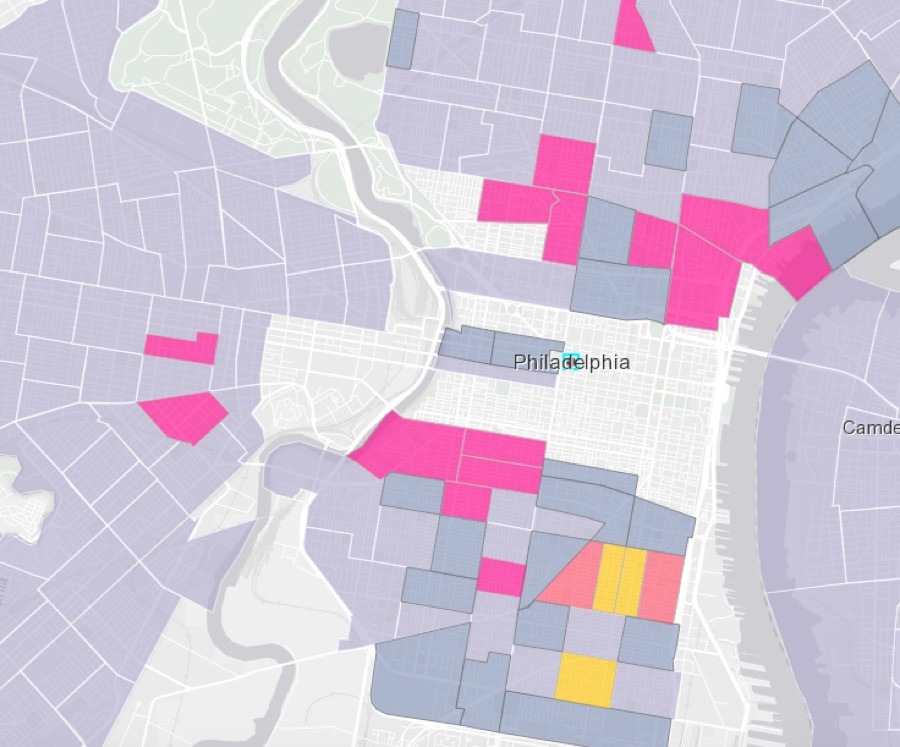
In Philadelphia, the vast majority of the city is either undergoing or a candidate for gentrification. The bright colors are neighborhoods that have gentrified; the light blue is for neighborhoods eligible for gentrification.
In San Francisco, meanwhile, many neighborhoods were already so prosperous in 2000 that they weren’t even eligible, suggesting that any gentrification in those areas may have already taken place by 2000. San Francisco, it seems, is in a later stage of its gentrification timeline than Philadelphia. (The late stage, at least for San Francisco, with its affordable housing crisis, isn’t so desirable, either.)
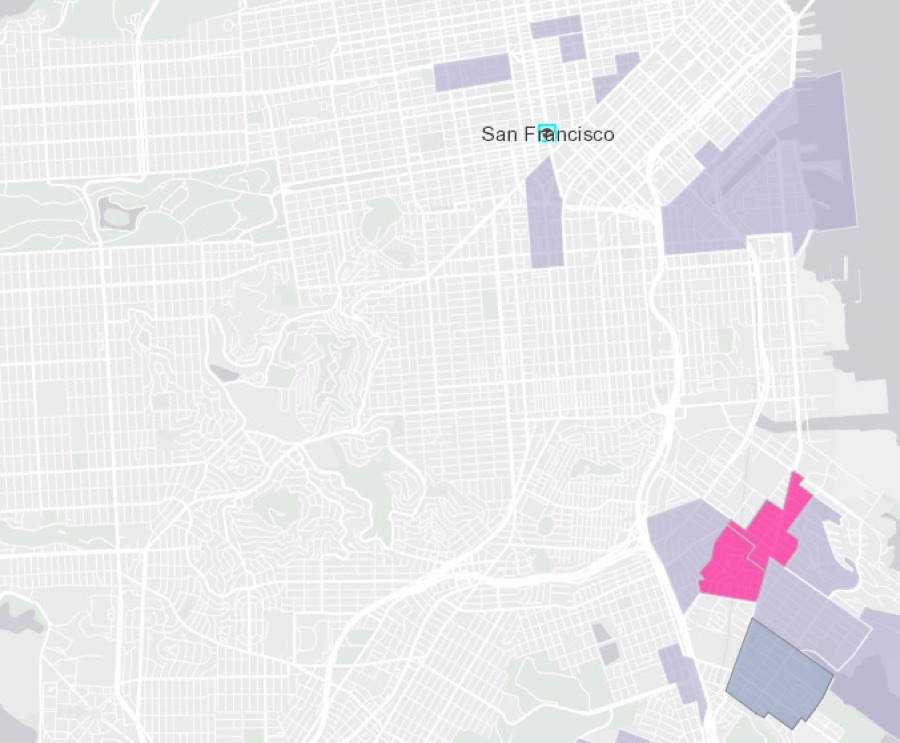
Much of central San Francisco, by comparison, was not even eligible for gentrification in the year 2000, as median income levels were higher than average.
To determine if gentrification actually took place— you can read the full methodology here — the NCRC tracked multiple factors, including whether an area experienced an increase in home values and income, and the number of highly educated residents. This is where definitions matter: While the NCRC came up with a total of 57 gentrified tracts in Philly, a Pew Charitable Trusts study from 2016 adopted a more narrow definition, finding that only 15 of Philly’s census tracts had gentrified over a similar period. Clearly it’s a subjective endeavor.
Definitions aside, the NCRC study is valuable in that it also focuses on something empirical: the number people who moved out of their old neighborhood amid these changing dynamics. Developers will often claim that an increase in property value benefits everyone — the “rising tide raises all boats” theory. But by comparing population levels between 2000 and 2013, the NCRC makes it clear that longtime residents of a neighborhood often end up leaving and not reaping those new benefits.
In Philadelphia, displacement is particularly acute among the city’s black population. Of the 57 tracts that the NCRC deemed gentrified, 16 showed a significant decline in black residents, the third most of any city in the country. On average, nearly 750 black residents moved out of these neighborhoods — just as some 770 white people on average moved in. A study by the Philadelphia Federal Reserve in 2016 suggested that gentrification may not actually be causing people to move away, since lower income residents in both gentrifying and non-gentrifying areas tended to have the same rates of mobility. But whatever the root cause, the effect is that in many neighborhoods, white residents are moving in and replacing people of color. With this dynamic at play, it’s no wonder Philadelphia is among the most segregated cities in the United States.
The forces of gentrification aren’t preordained. In an essay published along with the NCRC study, Beth McConnell, policy director at the Philadelphia Association of Community Development Corporations, fingers the city’s 10-year tax abatement policy as one of the culprits, writing, “Neighbors in older homes surrounding the new construction see their property taxes rise due to the improvements, while the new owners get a 10-year subsidy.”
The tax abatement could well be on its way out the door, but that alone isn’t going to reverse these trends. Remember, a huge chunk of Philadelphia is still eligible to be gentrified. The NCRC’s map can ultimately be read two ways: as a template for developers in search of the next fertile city land, or as a warning to city officials about the neighborhoods and communities that will be vulnerable to the next wave of gentrification. If the last two decades of Philly real estate history are any indication, the developers will build it. The question is whether gentrification (and displacement) will come.
This post has been updated to correct the explanation of the NCRC’s criteria for considering a census tract eligible for gentrification.