This Map Says You’re Probably Being a Jerk to Your Republican Neighbor
Philadelphia County is more politically intolerant than 95 percent of the country, according to a new map published by the Atlantic.
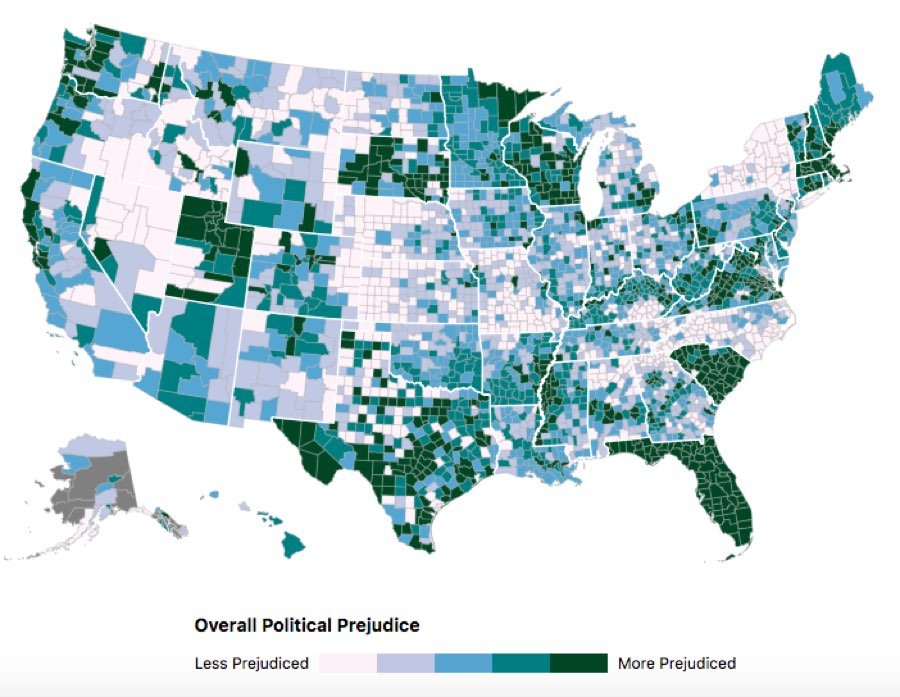
Darker colors on this map signify more hatred of one’s political enemies. Thanksgiving family dinner must be real fun in Florida. (Map by PredictWise.)
One of the ironies of our current political situation is that while the country stretches farther and farther apart ideologically, everyone seems to agree that partisanship itself is one of the fundamental afflictions from which we suffer. Theories abound regarding its cause: cable news networks, social media echo chambers — you get the idea. The effect, meanwhile, is clear: an increasingly ineffective and divided Congress, and, as posited in the famous political science book from 2012 It’s Even Worse Than It Looks, a potential full-scale poisoning of the American political system.
On Wednesday, the Atlantic added to this budding field of partisanship literature with a map that purports to show levels of political intolerance in each county across the United States. In keeping with the bleak political news, the map shows that Philadelphia County is more politically intolerant than 95 percent of all other counties in the U.S. — making it the most intolerant county in the entire state of Pennsylvania. So much for being the City of Brotherly Love!
To what can we attribute our apparent political nastiness?
“The most politically intolerant Americans,” the study finds, “tend to be whiter, more highly educated, older, more urban, and more partisan themselves.”
That doesn’t exactly provide an obvious explanation as to why Philadelphia is so partisan — with a population that is more black than white and has been skewing younger in recent years. But it does help us to understand the dynamic in the surrounding counties — Montgomery and Delaware in particular — where political prejudice is in the 85th percentile and the population is majority white, as well as more educated and older than the national average.
The research also breaks down inter-party angst, finding that on the whole “Republicans seem to dislike Democrats more than Democrats dislike Republicans.” And yet, specifically in Philadelphia, we see the opposite occurrence. Philadelphia Democrats are “considerably more prejudiced” against Republicans than their fellow liberals elsewhere. The few Republicans who do live in Philly, on the other hand, are much less prejudiced against Democrats than most conservatives. Although that part seems easier to explain: You’d have to really enjoy being miserable and alone if you were a Republican in Philly who couldn’t get along with any Democrats.
The study’s methodology, outlined here, is relatively simple on its face. Tobias Konitzer, a polling and analytics guru whom the Atlantic solicited to do the research, asked 2,000 Americans questions such as how they would feel if a child married a Democrat or Republican. Next, he analyzed the data and determined certain characteristics that were linked to more or less political tolerance, among them age, race, and education and urbanity. Using those traits and voter registration figures, Konitzer mapped out the likely political intolerance of each county in the United States. It’s a data-driven approach, to be sure, but one that also inspired a degree of skepticism among some national pundits.
https://twitter.com/mattyglesias/status/1103510386052157441
Of course, any sort of widescale mapping endeavor that tries to quantify something subjective — like partisan prejudice — with hard numbers is going to have certain nuances elided. As Vox’s Matthew Yglesias notes, it doesn’t really make sense that just by crossing a state border, two adjacent counties would have wildly different prejudice rates — especially when you consider there’s probably a large degree of interaction and dispersement between residents across state lines.
Former governor Ed Rendell reasons that given Philly’s strong Democratic makeup — which he says creates both a loyal Dem majority and a dedicated Republican minority — it’s obvious the city should score high marks on political intolerance. “My six-year-old grandson could tell you that a county with an 80 percent registration advantage is going to be more partisan and more intolerant than a county that’s 55-45. I don’t see the big news here.” Rendell also notes if the most partisan Americans are highly educated and mostly white, as the study claims, well, that doesn’t describe Philadelphia’s makeup. “Their conclusions are mutually inconsistent,” he says.
One member of that Republican minority, Philly GOP chair Michael Meehan, shares Rendell’s skepticism about the study’s methodology. “It’s very theoretical,” he says. But he doesn’t fight the notion of growing partisanship. “The fact that I have a relationship with Democrats is frowned upon by Republicans,” he says. “That’s the unfortunate state that we’re in today — people don’t even have conversations with their opposition.”
Remember the finding that Philly GOPers are more tolerant than Republicans elsewhere? Well, at least that part seems to check out.
So maybe there are some redeeming qualities to this map. The prevailing trend of hyper-partisanship is undeniable. And the Atlantic doesn’t profess to have all the answers, either: “It’s hard to know exactly what’s going on, but what’s clear is that both sides are becoming more hostile toward one another.”